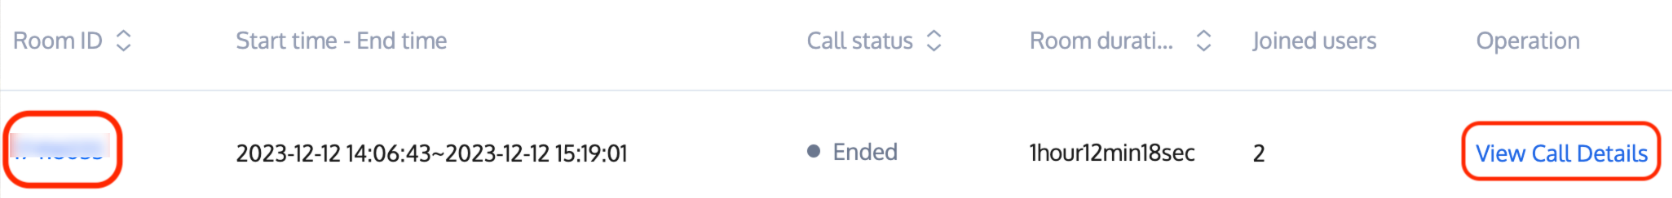
2. Click the Room ID or View Call Details on the right to go to the details page.
Information Displayed
Basic information
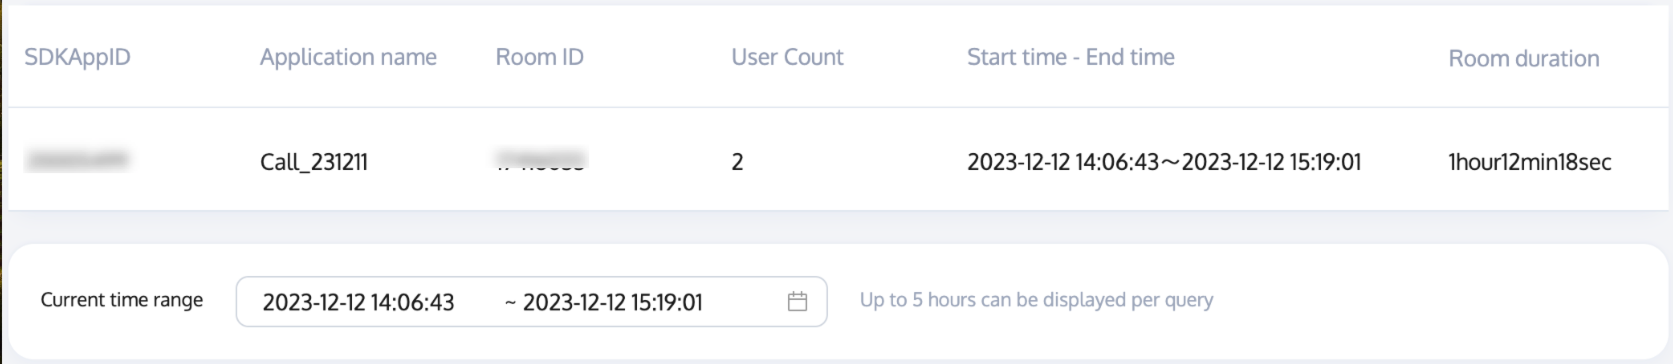
Call room information: the basic information of the call room, including SDKAppID, Application Name, Room ID, User Count, Start Time - End Time, and Room Duration.
Current time range: the time range queried. The calls of up to 5 hours can be displayed per query.
User list
This section shows the user information of the call, including user ID, role, type, region, stay in the selected time range, time of room entry and exit, length of stay, SDK version, SDK type, as well as device and network information.
Item
Description
User ID
By default, the recently joined 6 users are displayed. To display more than 6 users, click Add user or View All Users. Up to 20 users can be displayed.
User Role
Anchor or audience. Anchors can send and receive data, but audience can only receive data.
User Type
Upstream or downstream. A green up arrow means the user has sent data, and a yellow down arrow means the user has received data.
Region
The geographic location of the user
User’s Stay in This Period
A blue segment represents the period when the user is in the room, and the gray segment represents the period when the user is not in the room.
Room In/Out Time
The time of the user’s first entry and last exit.
Duration
The length of the user’s stay in the room.
SDK Version
The version number of the user’s SDK.
SDK Type
The type of SDK used by the user, see the documentation SDK Download for descriptions.
Device
The model or number of the device used by the user
Network
The network type used by the user
Data received and sent
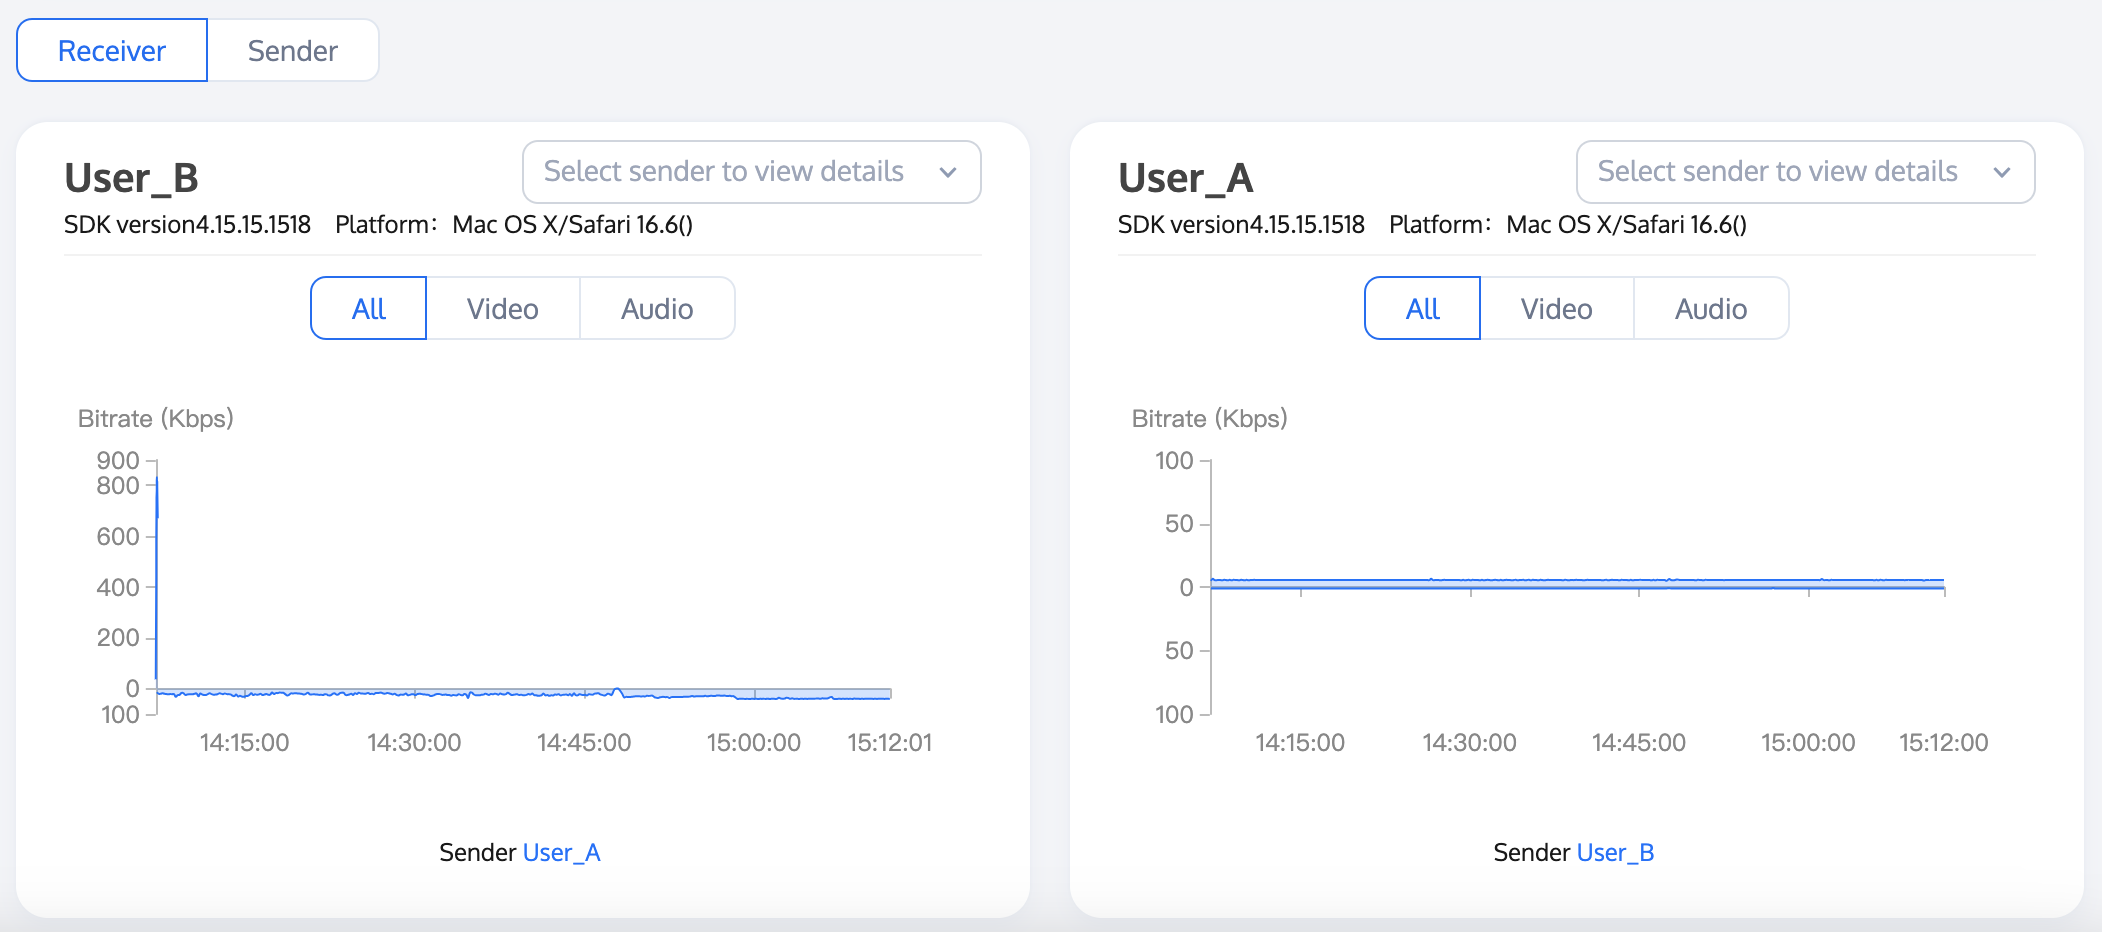
A user in a call receives the data of other users while sending local data. It is therefore necessary to display the information of data going both ways. By default, the call details page of the monitoring dashboard displays statistics from the perspective of the receiver. You can also switch to the perspective of the sender.
Receiver
You can switch between four tabs: All, Video, Audio, and Screen Sharing. A tab is displayed only if the corresponding data is received.
By default, the graph shows the data received from all remote users, which is marked by different colors. You can view an overview of a single user's data by clicking Select sender to view details and selecting the specified sender user.
Red lines in the graph indicate network jitter. You can click Select sender to view details in the top right and select the corresponding user ID to check the details in End-to-End Details.
If a long time span is displayed, you can use the mouse wheel to zoom in part of the graph to view the details of a specific point.
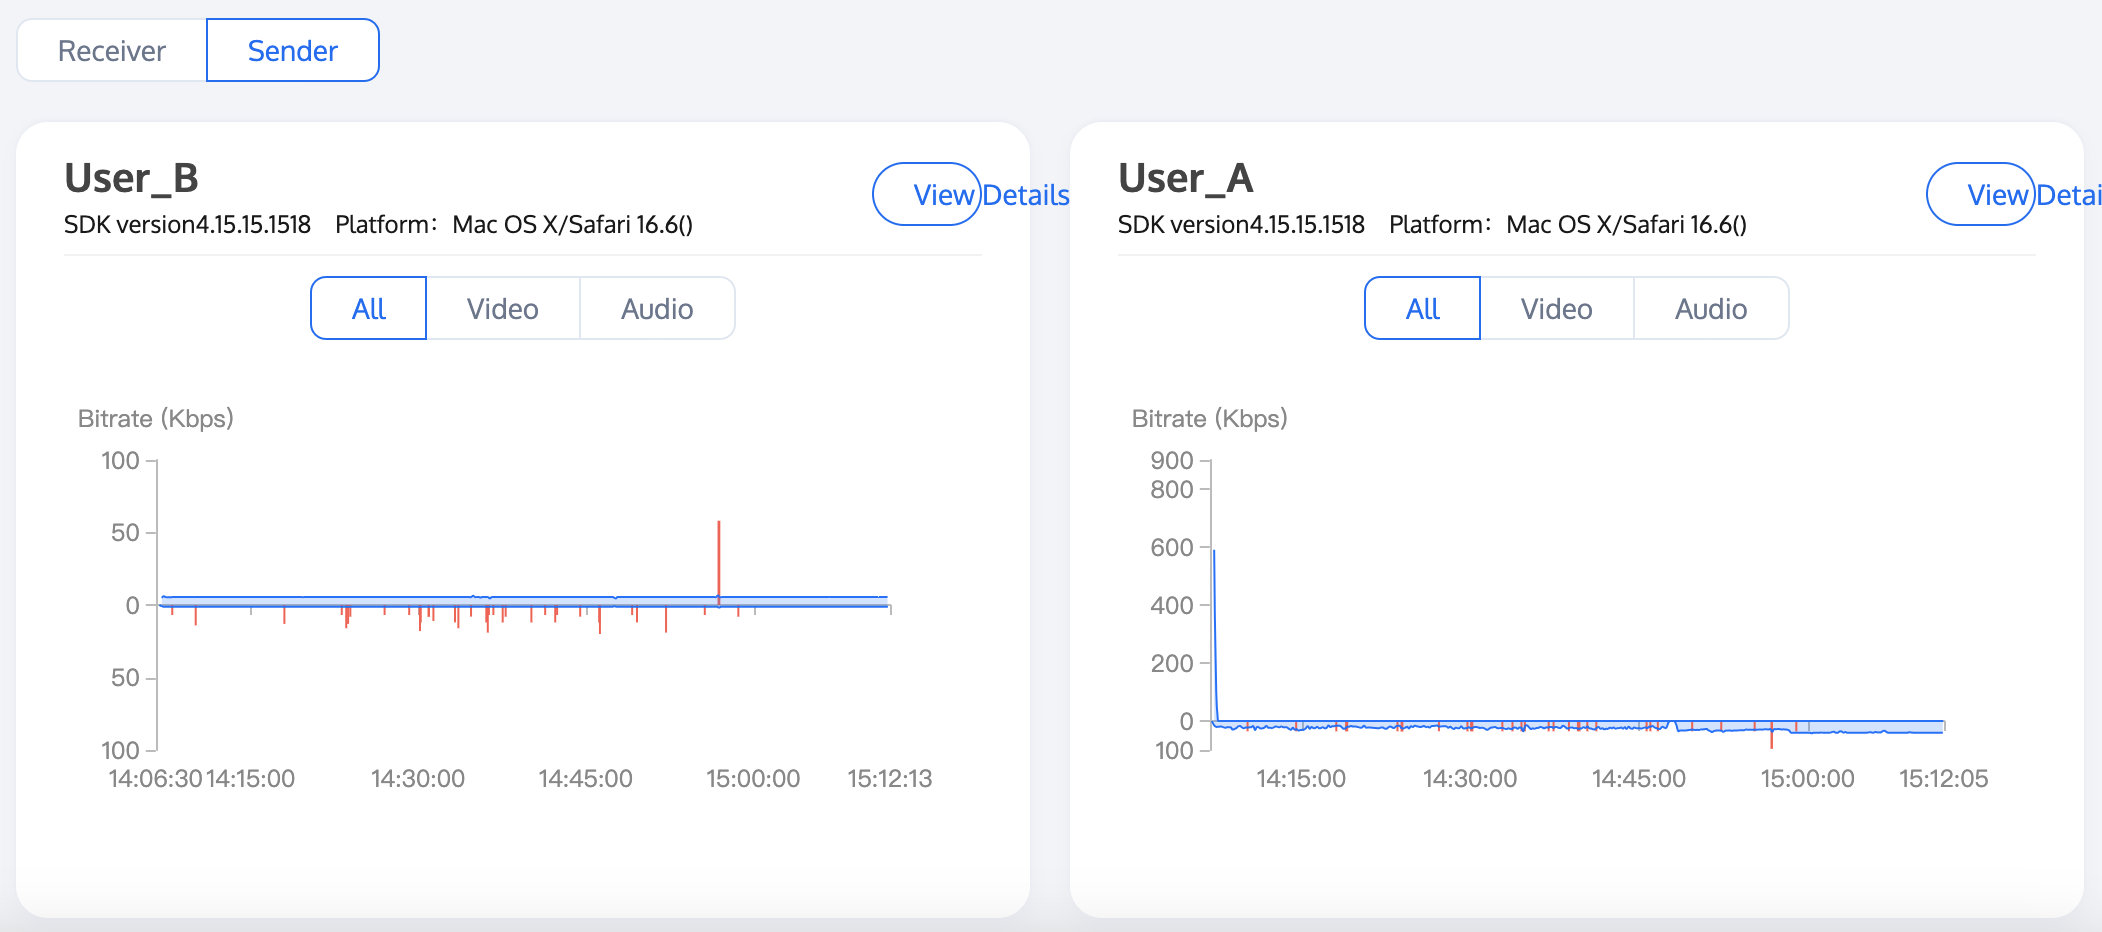
Sender
You can switch between four tabs: All, Video, Audio, and Screen Sharing. A tab is displayed only if the corresponding data is sent.
Red lines in the graph indicate network jitter. You can click View details in the top right to check the details in End-to-End Details.
If a long time span is displayed, you can use the mouse wheel to zoom in part of the graph to view the details of a specific point.