The Data Insights on RTC Analytics provides features for viewing and analyzing the scale and quality data of business operation dashboard from an application dimension. It helps you quickly understand the call scale data and trends under the application (sdkappid) while offering insights into call quality across multiple dimensions.
Note:
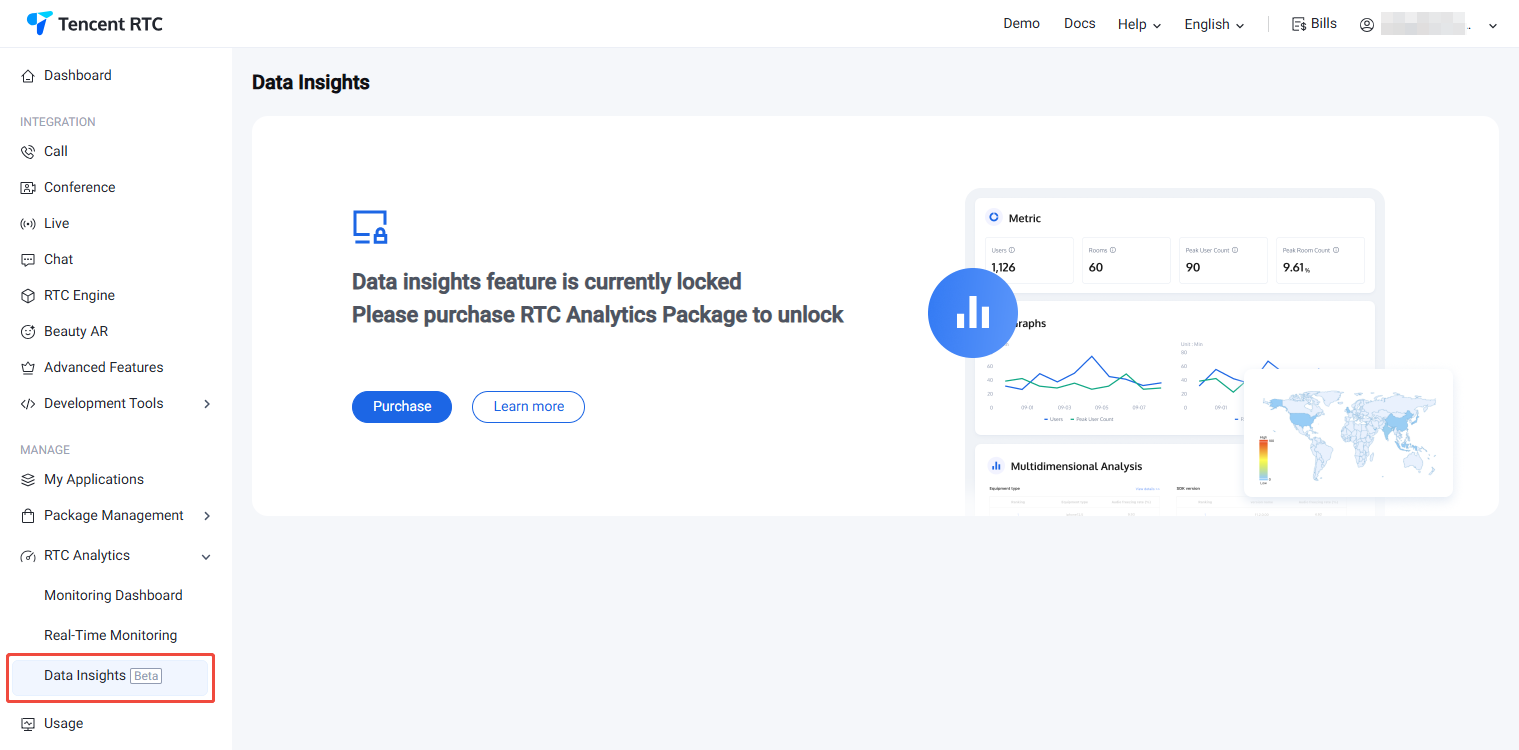
The Data Dashboard is a paid feature and requires a subscription to the paid version to unlock additional features. For more information, see Version Features and Billing Information of Data Monitoring.
Feature Overview
Features of the Data Dashboard:
Dashboard Data: Supports viewing the number of users, the number of rooms, the number of users during peak hours, and the number of rooms during peak hours over a specified period, providing a quick overview of the operational scale.
Multi-dimensional Quality Analysis: Supports viewing room call quality across various dimensions over a specified period, including metrics such as video stutter rate and audio stutter rate, enabling timely insights into call quality across different dimensions in business operations.
To use this feature, activate the Data Monitoring service in advance. The data query range for the Data Dashboard starts from the next day after the service activation. Historical data prior to the service activation is not included in the statistics and cannot be retrieved.
2. Filter the desired application (sdkappid) and select the time range to view. Currently, the free version (default) allows filtering for up to the past 7 days, with a maximum range of 60 days available by unlocking the RTC Analytics Monthly Packages.
Feature Description
Dashboard Metrics
Statistical Metrics: The dashboard metrics provide four key operational scale metrics: the number of users, the number of rooms, the number of users during peak hours, and the number of rooms during peak hours. These metrics help you quickly understand the operational scale of the current application within the selected time range.
Metric
Description
The number of users
The total number of users who joined a room during the selected time range (deduplicated by userID and the combination of create_time and roomID).
The number of rooms
The total number of rooms created during the selected time range (deduplicated by the combination of create_time and roomID).
The number of users during peak hours
The maximum number of users in a room simultaneously during the selected time range, calculated at a 1-minute granularity.
The number of rooms during peak hours
The maximum number of rooms existing simultaneously during the selected time range, calculated at a 1-minute granularity.
Note:
For the number of users, if the same user (userID) joins different roomID, it will be counted as two users; similarly, if the same user (userID) joins the same roomID created at different times, it will also be counted as two users.
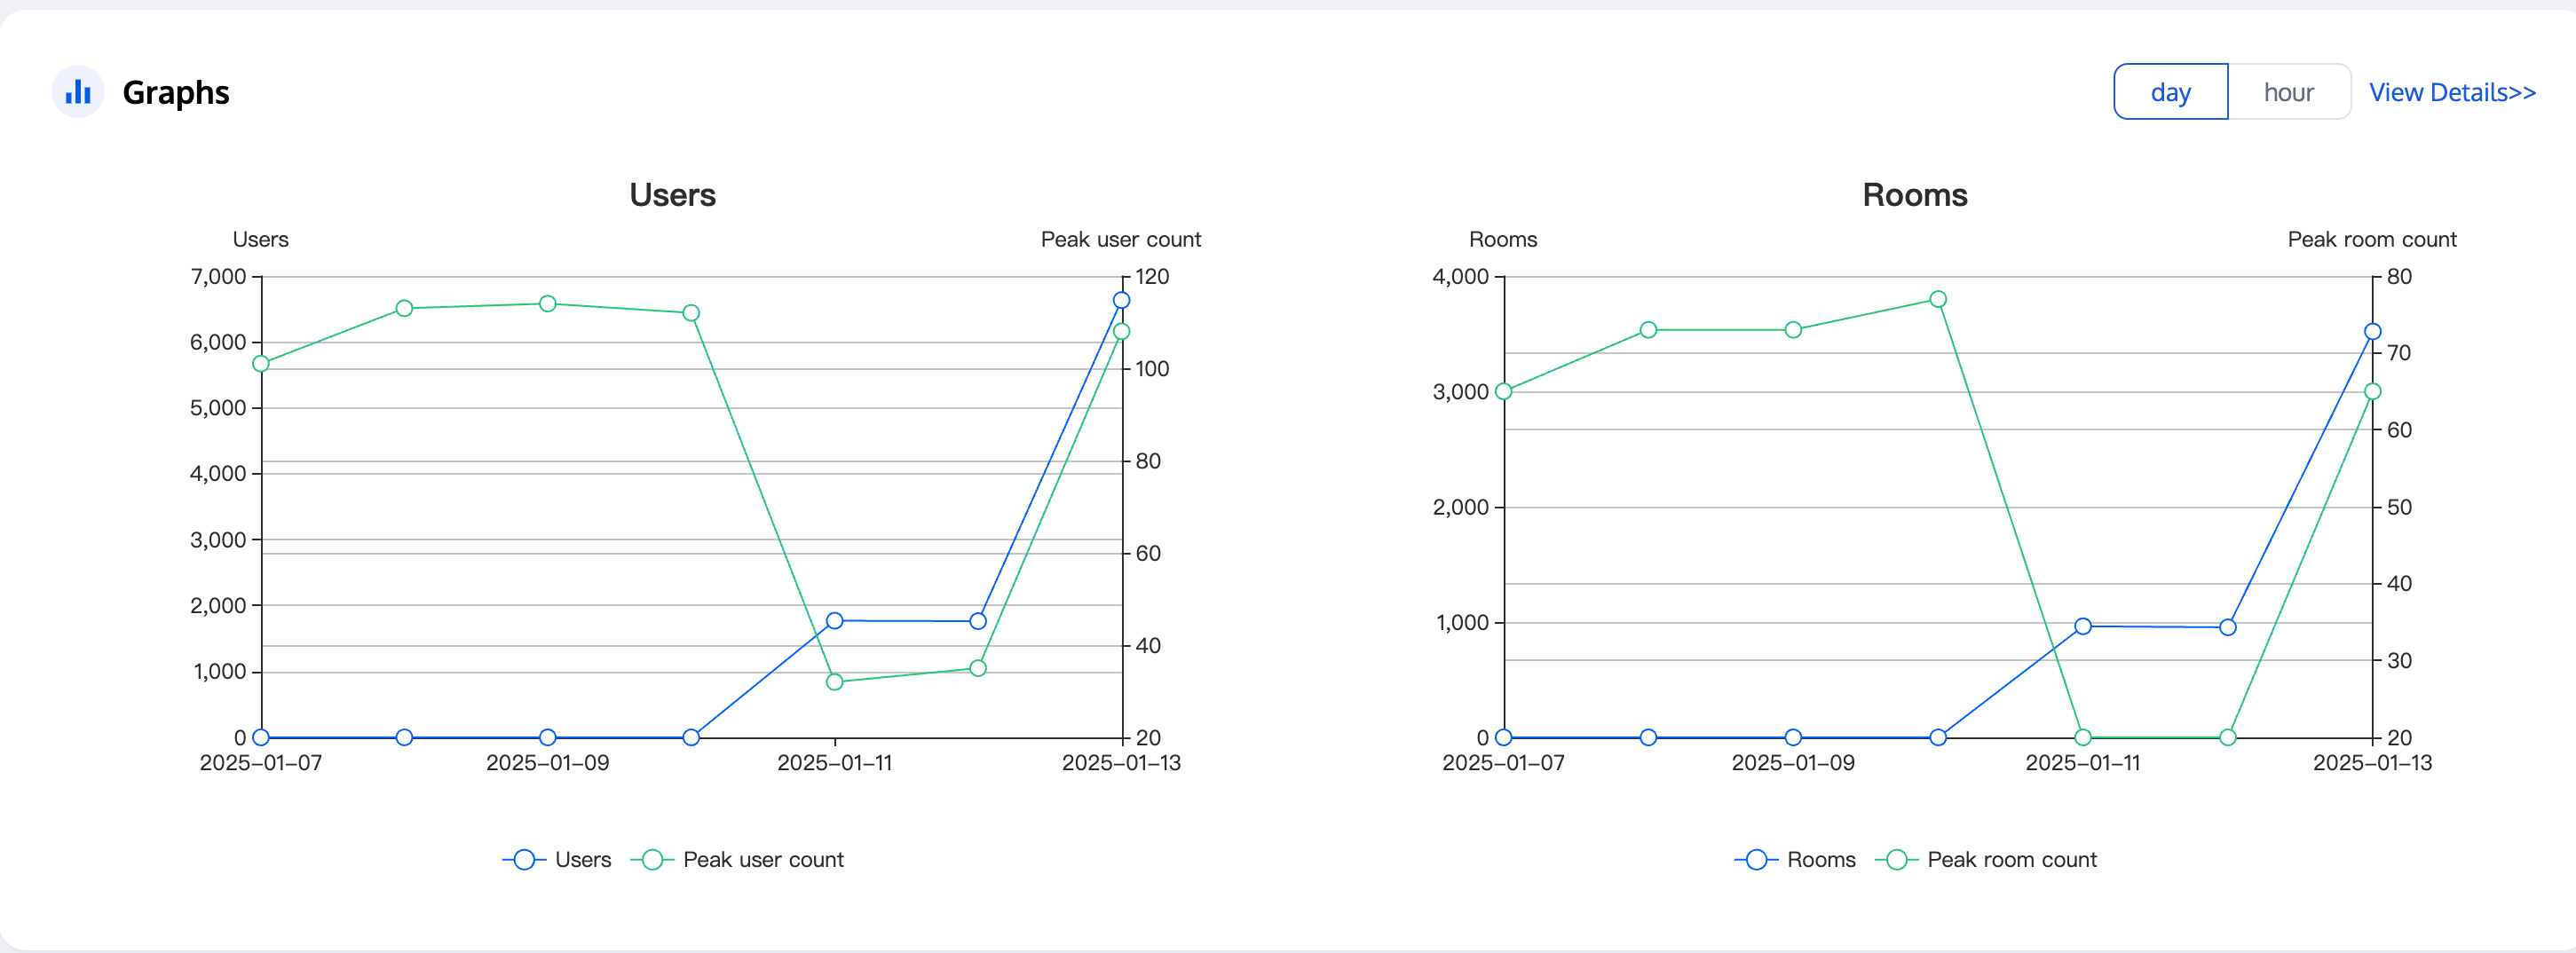
Graphs: They provide trend line charts for the above metrics, supporting both daily and hourly views:
If you view by day, you can see the scale metrics for that day at each coordinate point.
If you view by hour, only hourly granularity data for a single day is supported, with Indicator Statistical Rules as described above. When you switch to hourly granularity, the display automatically switches to the most recent day within your selected date range.
Note:
Since there may be call rooms spanning across hours, the number of users in the same room may be counted separately in two adjacent hours. As a result, summing up hourly granularity data for a day may yield a higher total number of users and rooms than the daily dimension statistics.
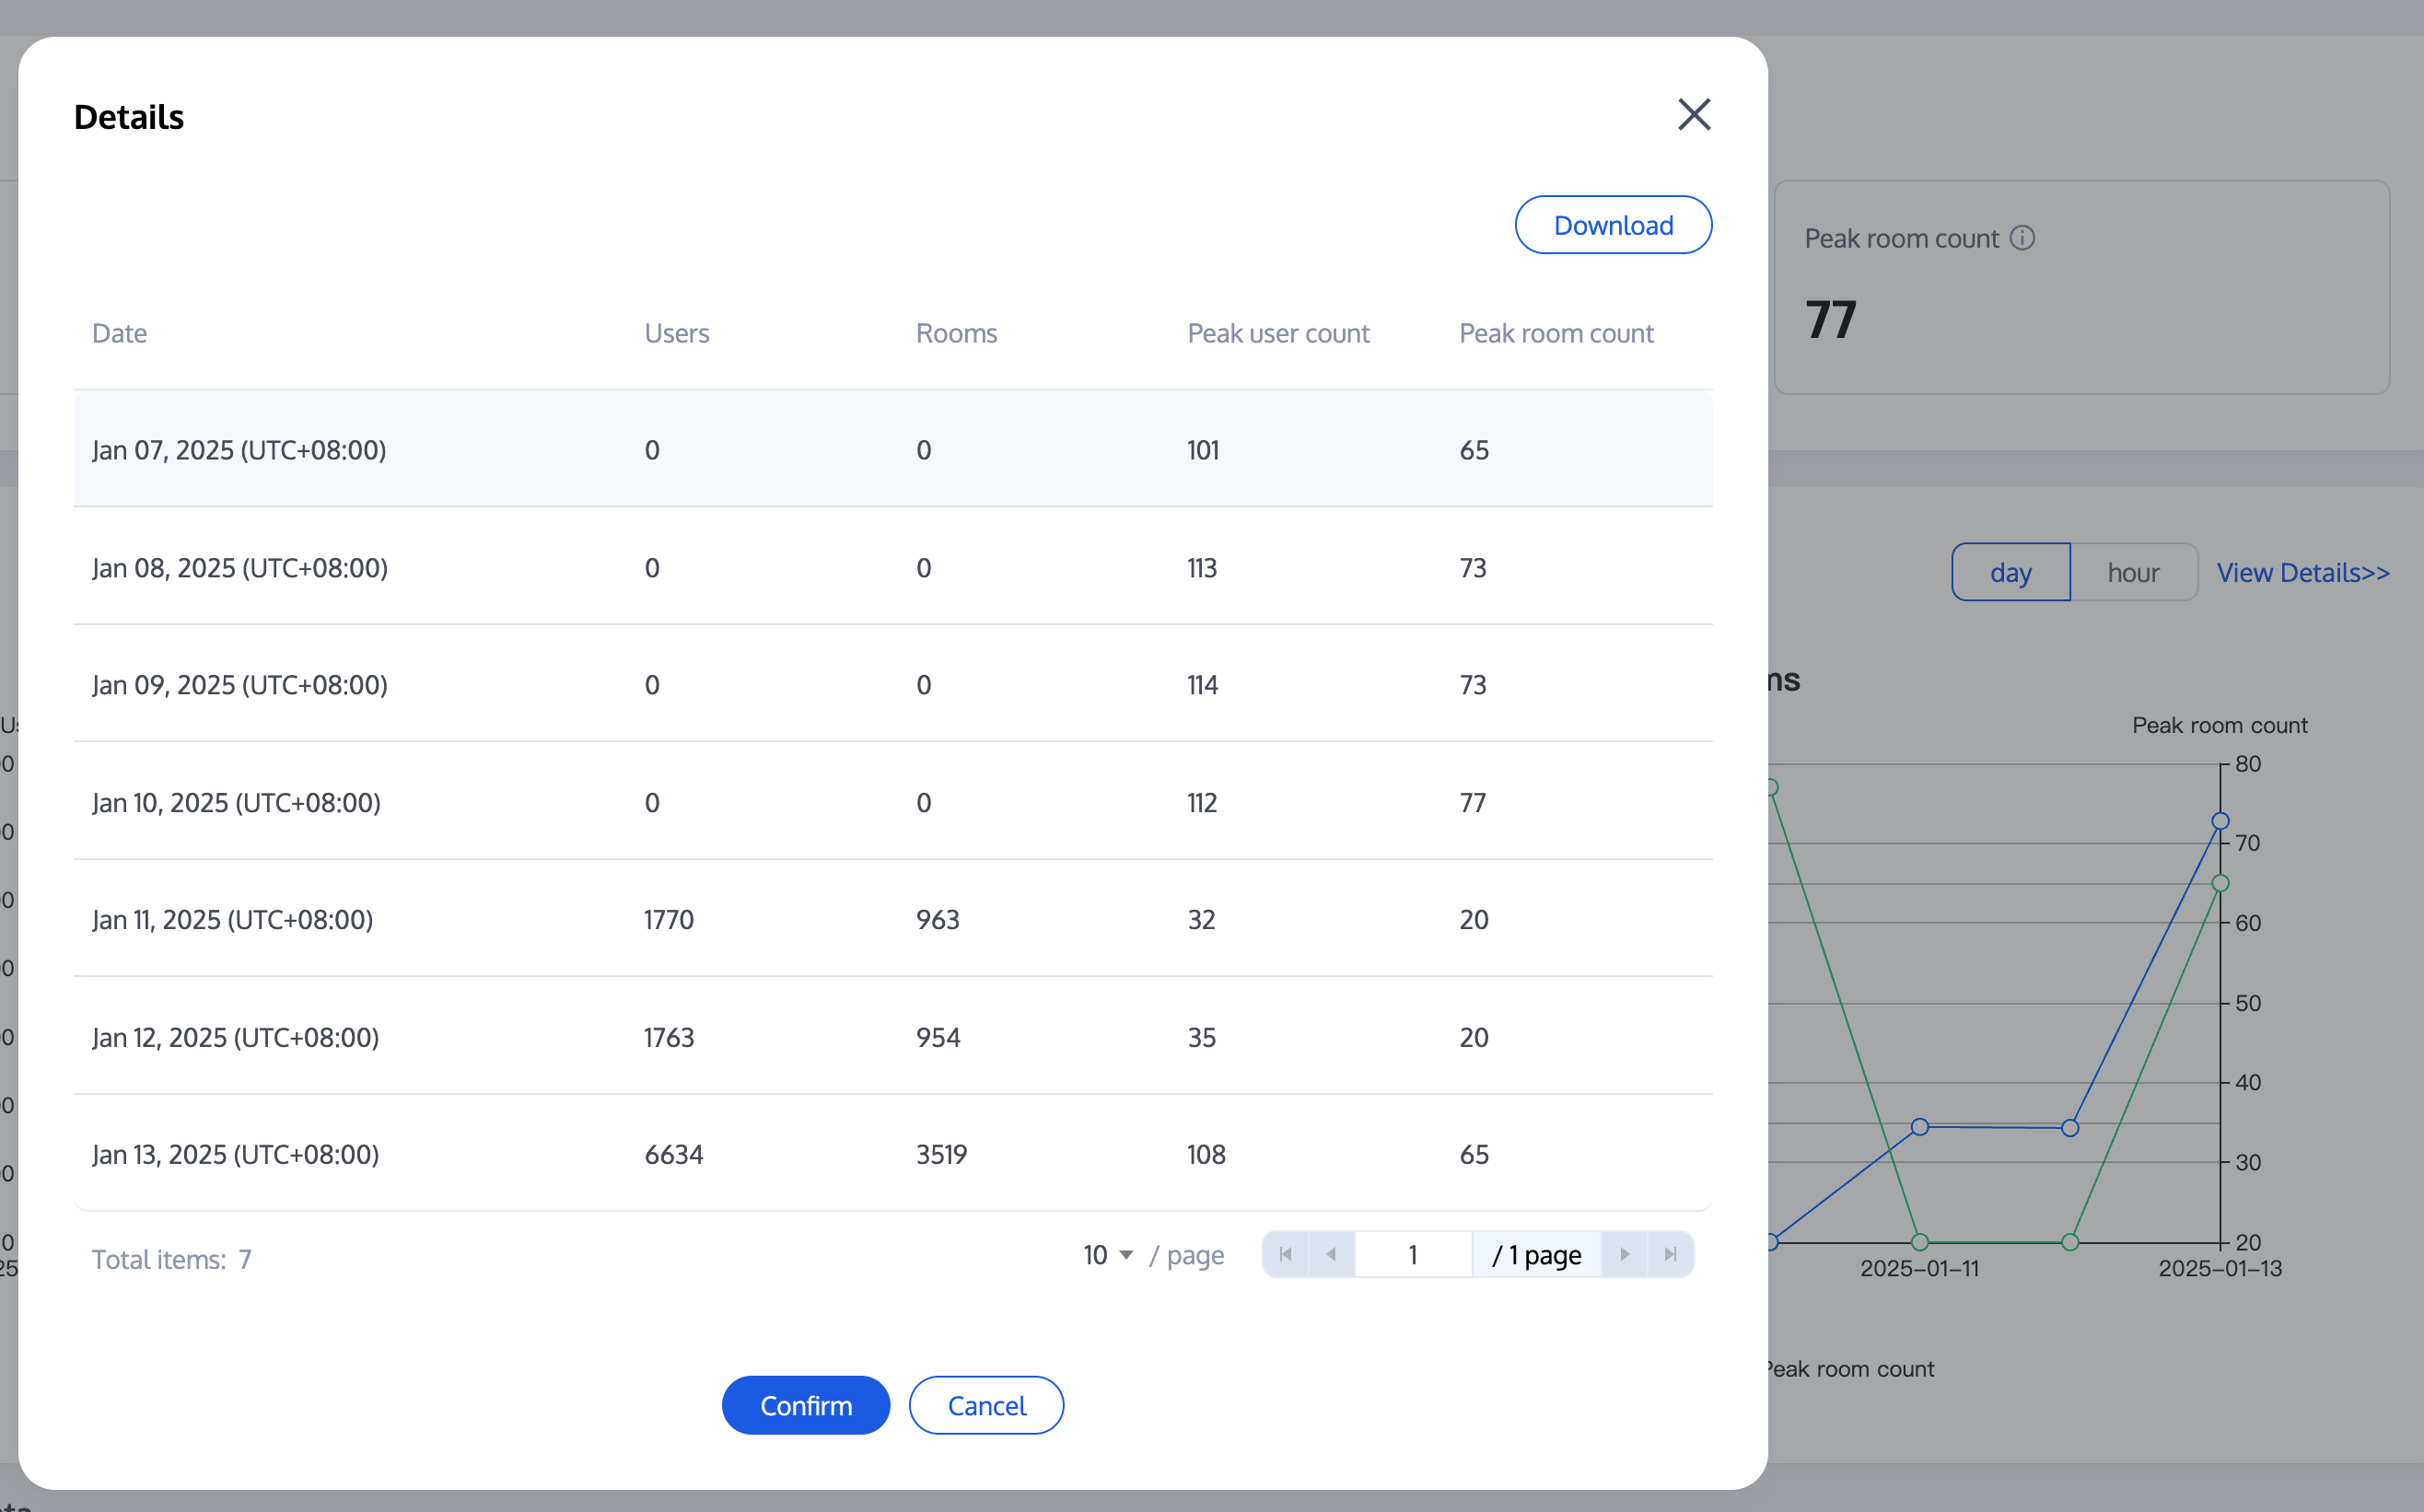
You can click View Details to access the corresponding data details, with an option to export the data.
Dimensional Data
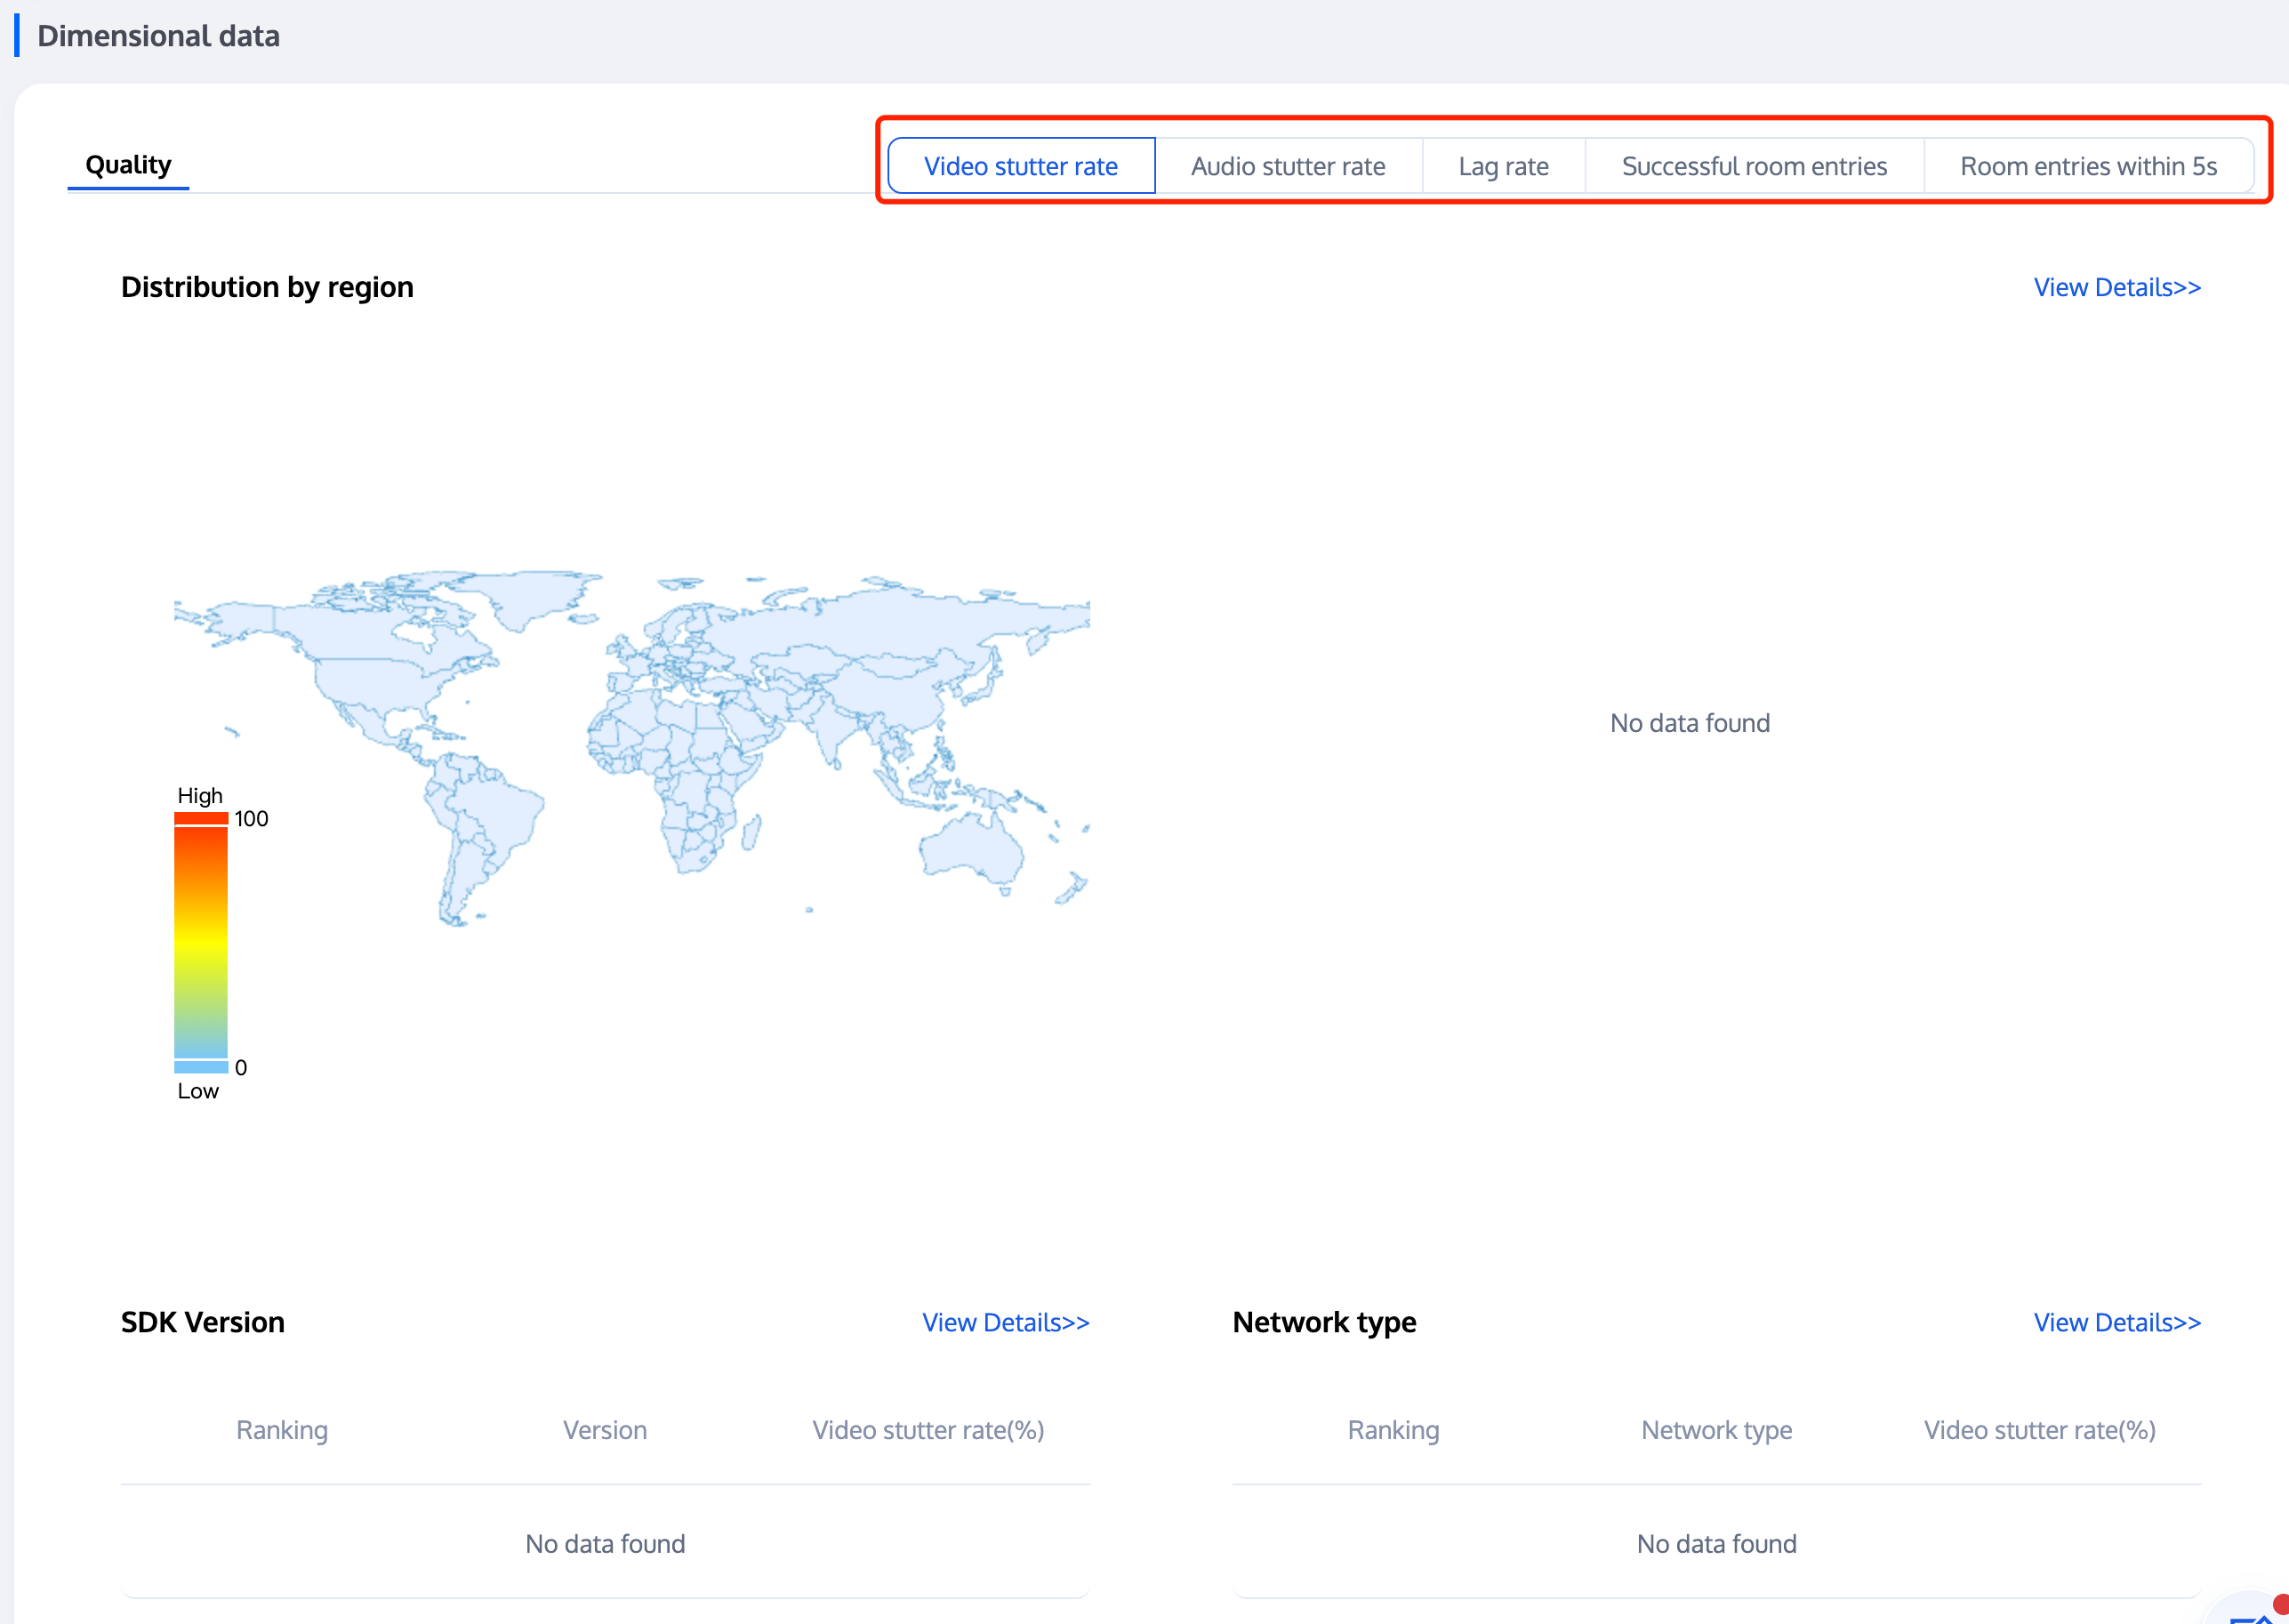
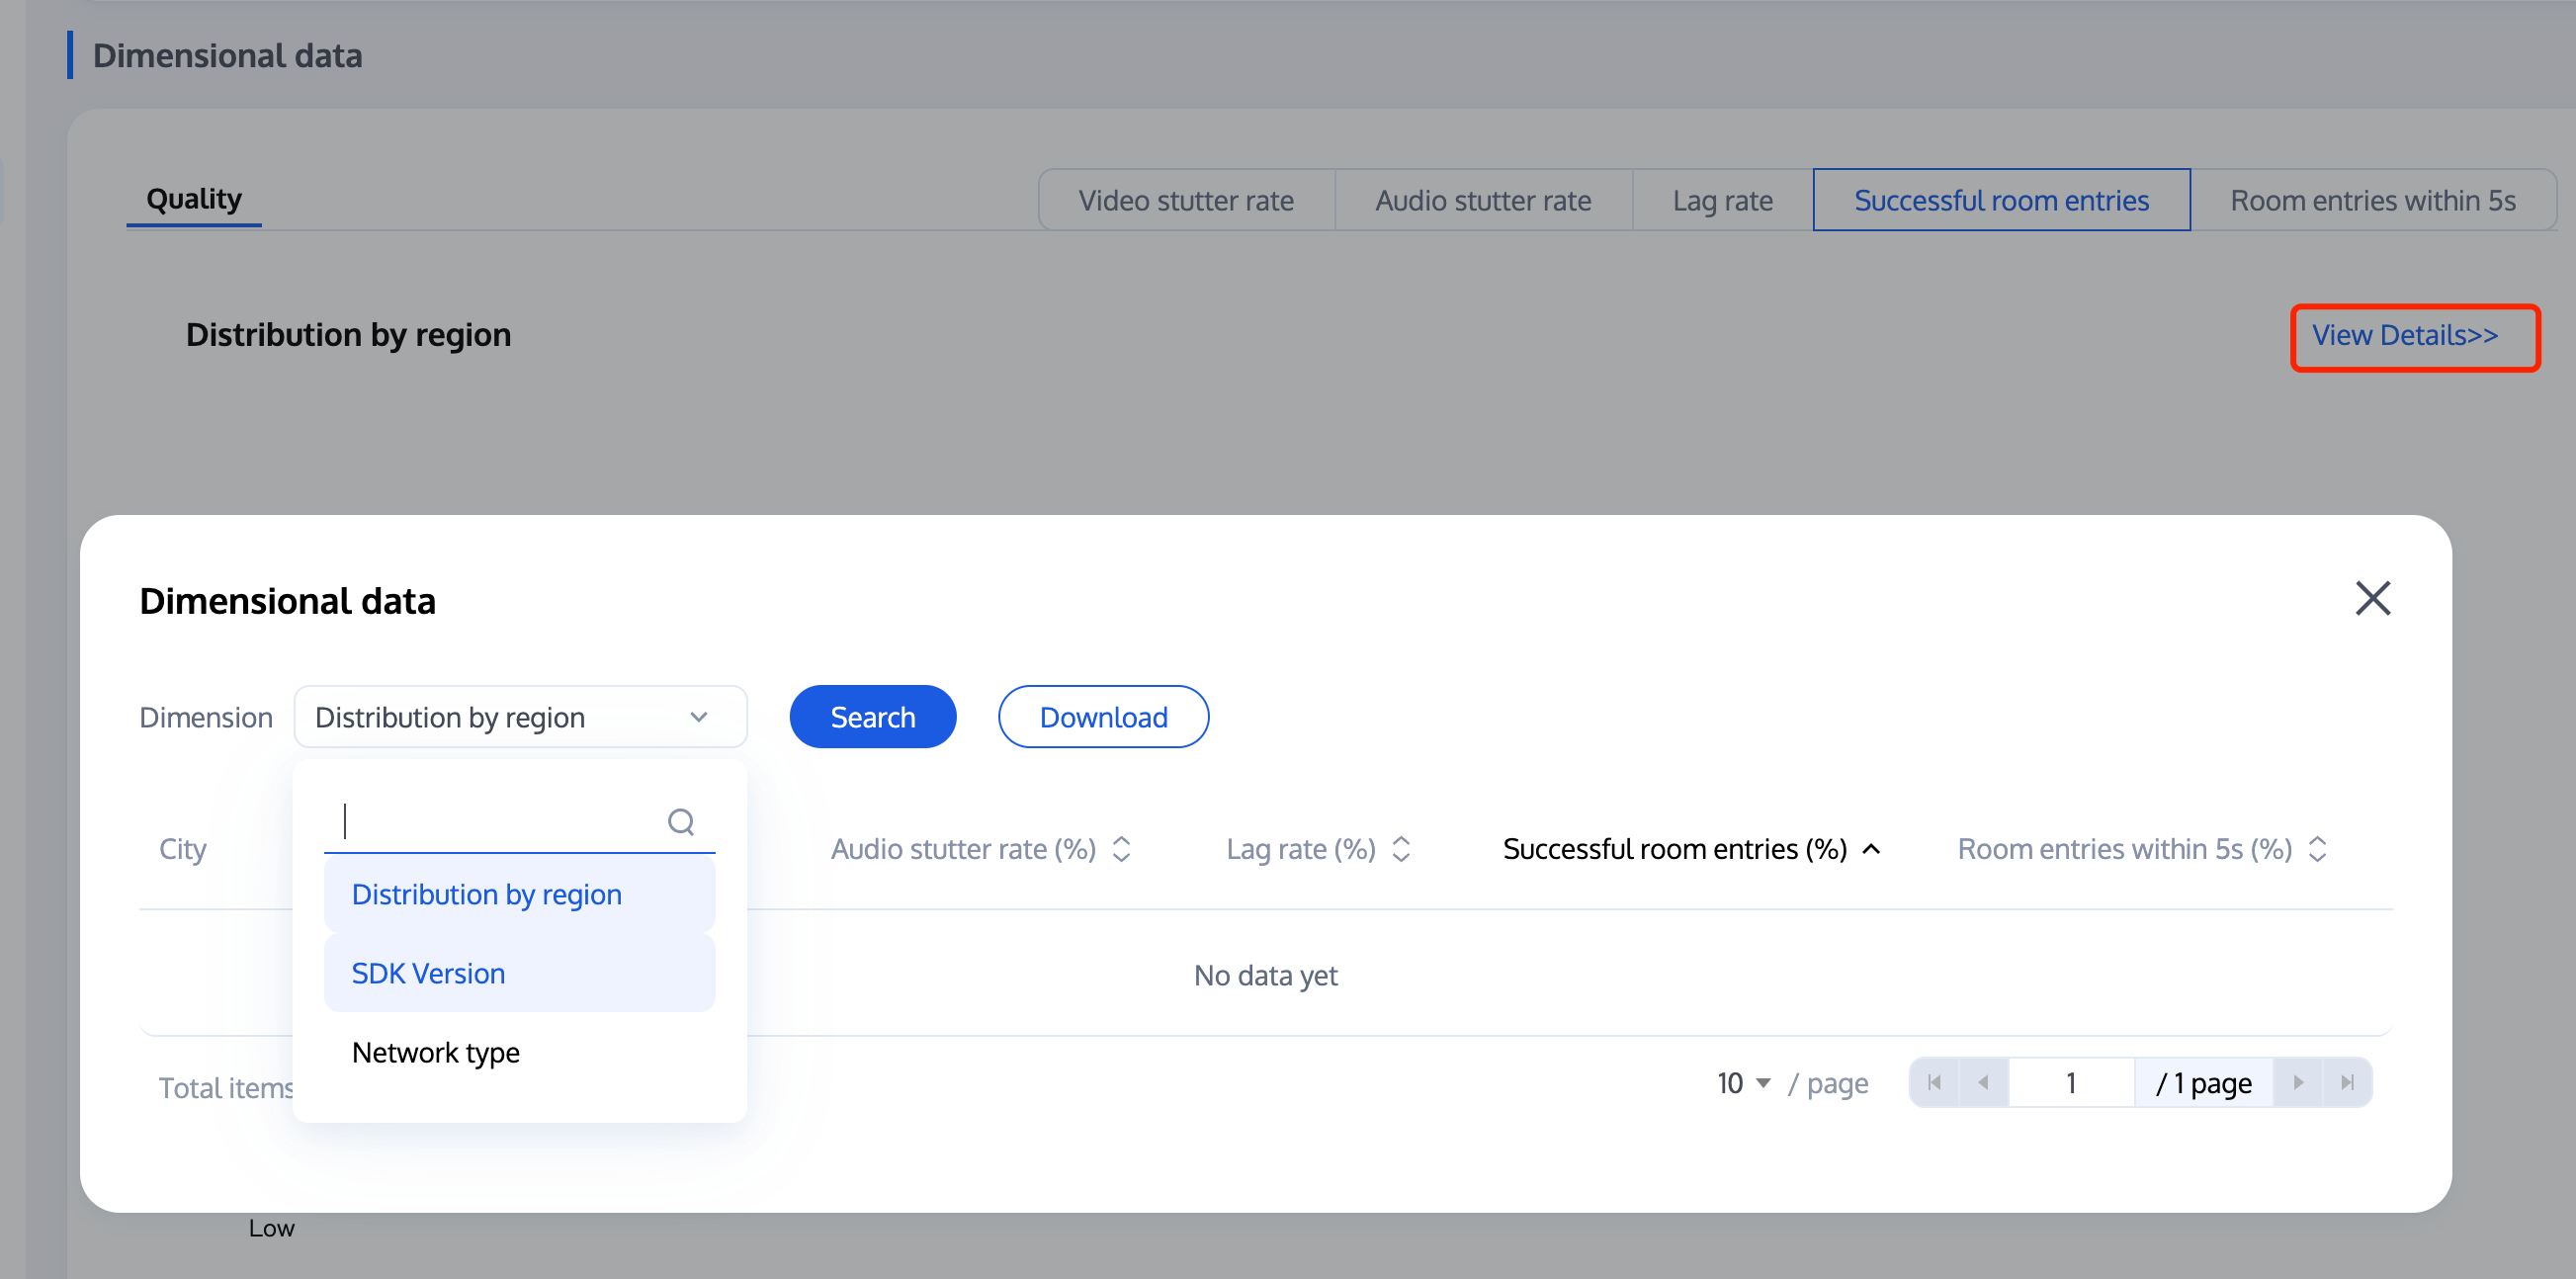
Quality: The quality under dimensional data provides the feature to query call quality metrics across various dimensions (such as region, SDK version, and network type). You can view the desired quality metrics under the corresponding dimension module and click View Details to access all detailed data, as shown below.
You can click View Details to filter by the corresponding dimensions and access detailed data.
Quality Metrics
Metric
Description
Video stutter rate
The duration of video stutters / the total video duration x 100%. A video stutter lasting more than 600 ms is included in the stutter duration.
Audio stutter rate
The duration of audio stutters / the total audio duration x 100%. An audio stutter lasting more than 200 ms is included in the stutter duration.
Lag rate
The duration of end-to-end network lag / the total audio and video duration x 100%. An end-to-end network lag exceeding 400 ms is included in the lag duration.
Successful room entries
The number of users who successfully joined a room / the total number of users who attempted to join x 100%.
Room entries within 5s
The number of users who successfully joined a room within 5 seconds / the total number of users who attempted to join x 100%.
Dimensions
Dimension
Description
Distribution by region
The province where the user is located, distinguishing between regions of the Chinese mainland and regions outside the Chinese mainland.
Device type
The type of device used by the user.
SDK version
The SDK version used by the user during the call.
Operator
The network operator used by the user.
Network type
The type of network used during the call, such as wired, Wi-Fi, and 4G.
RESTful API
The Data Dashboard feature provides RESTful APIs, allowing you to retrieve relevant data through API requests.
Note:
The Data Dashboard RESTful API is only available to customers who have subscribed to the Basic Edition or Advanced Edition of the Data Monitoring service. For details on enabling the Data Monitoring service, see Version Features and Billing Instructions.